
There is a moment every direct selling executive knows. A major event brings the field together, a new product is launched or an incentive gives people a clear target. Activity rises, sales accelerate and the company celebrates. The more revealing moment comes later, when the campaign has ended and the business has to stand on its own again.
Does it settle at a higher level, supported by customers who reorder and partners who have built new habits? Or does it drift back towards its previous baseline, leaving the organization to wait for the next promotion to create another surge? That difference matters: a record month tells us how high the business rose, but not whether the underlying business changed.
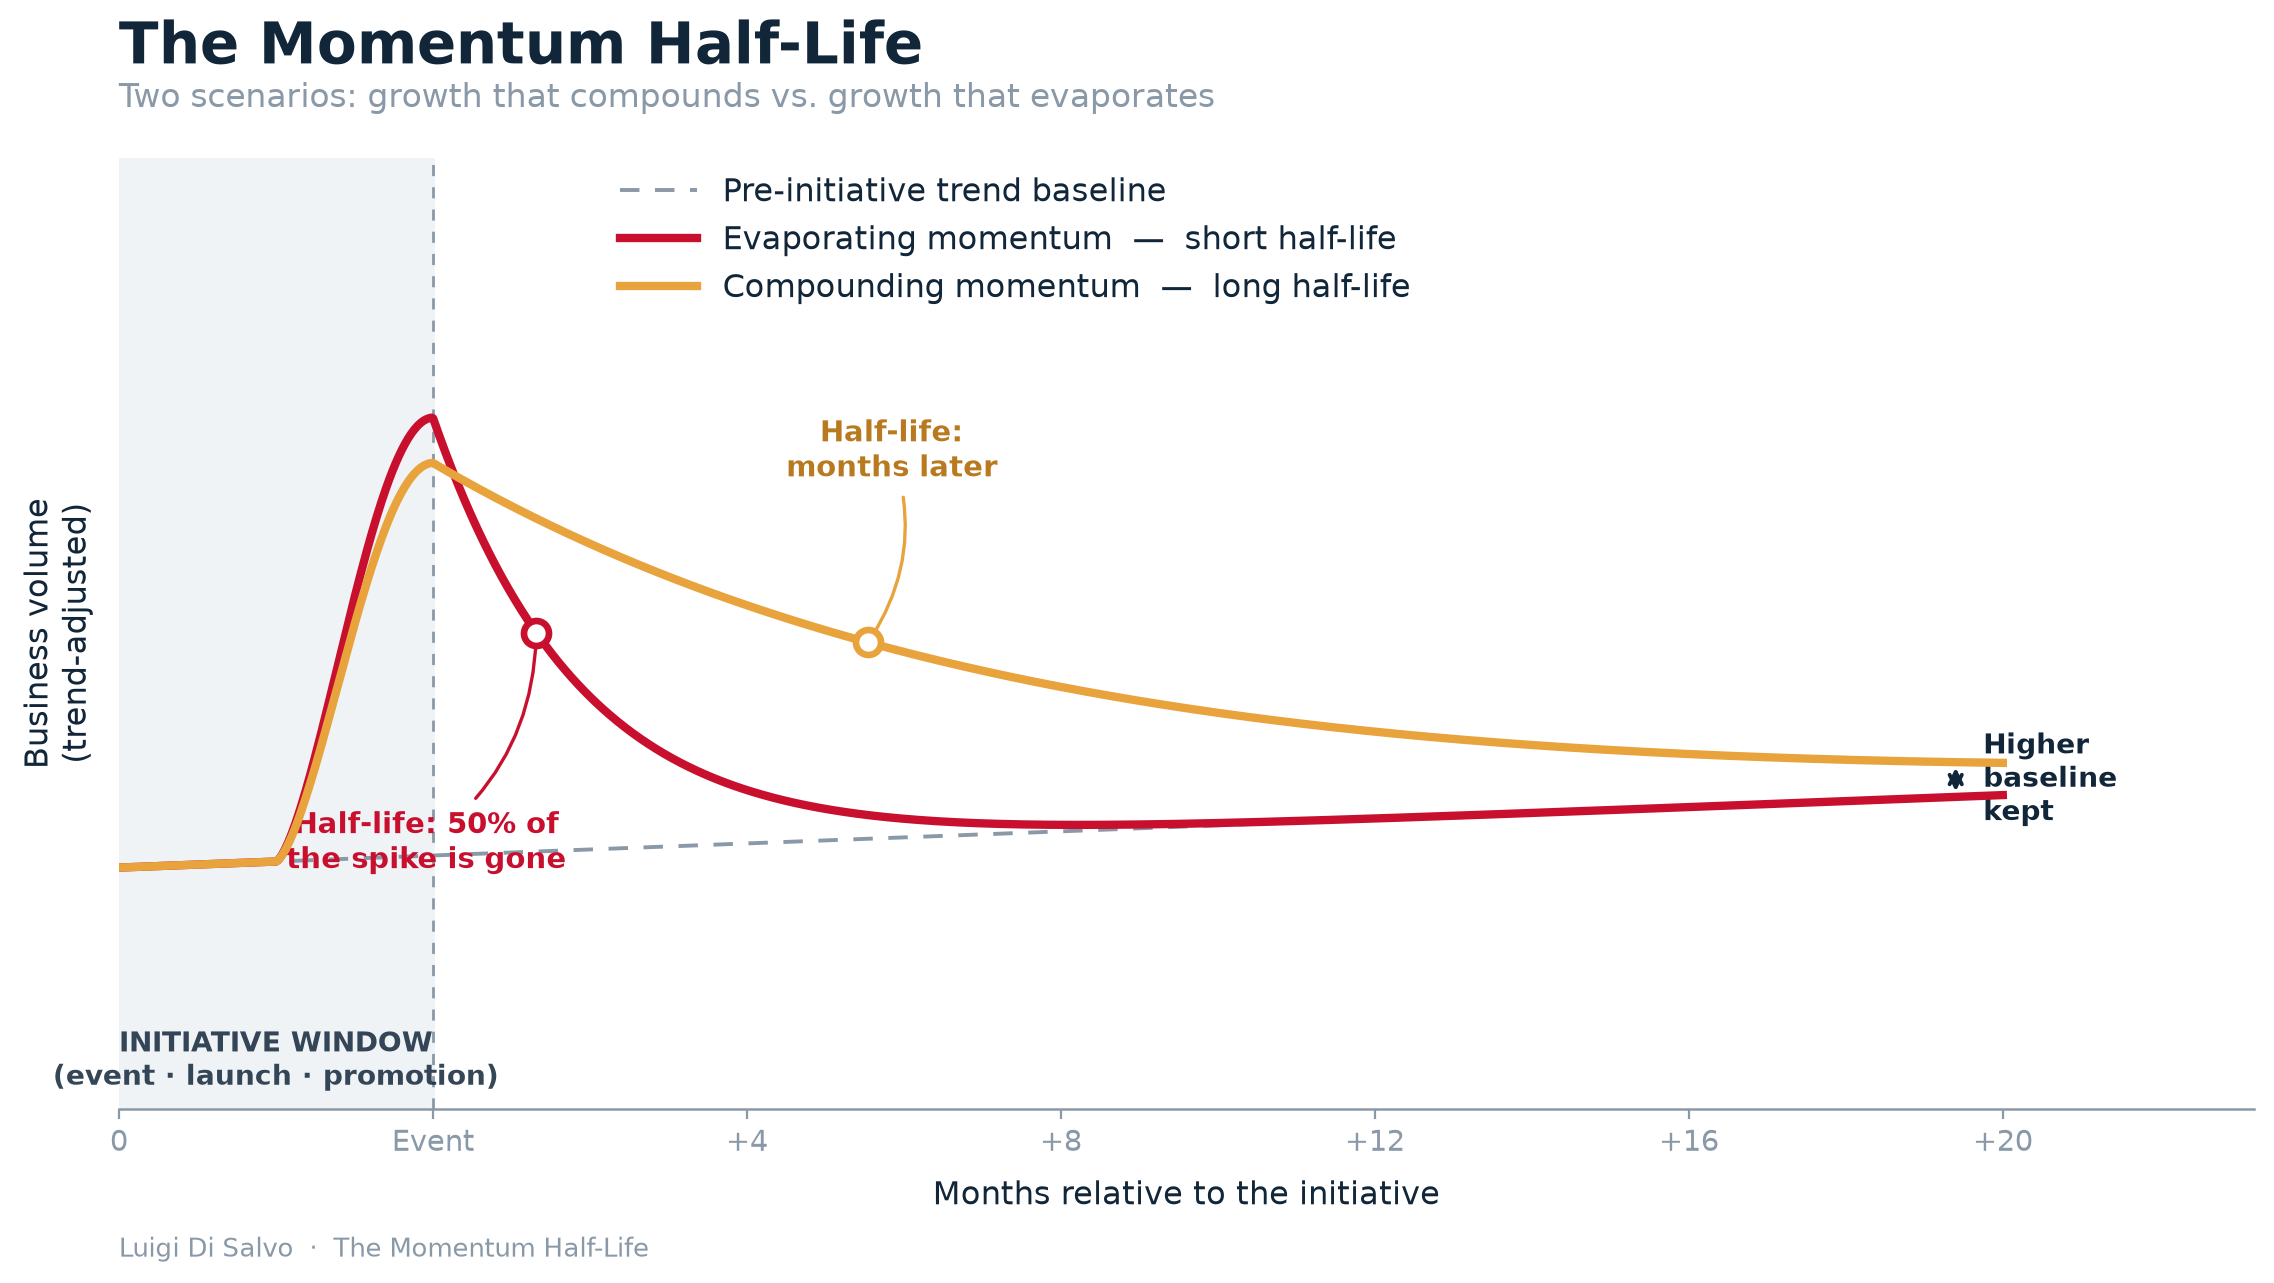
I think about this as the momentum half-life: the time it takes for half of the incremental business generated by an initiative — an event, product launch, promotion or market opening — to disappear after the initiative ends. The size of the peak is visible; the speed at which the lift fades is just as important, but much less often measured.
Problem one: momentum decays — and few companies measure it
Most companies track monthly sales, year-over-year comparisons and event results. These measures are useful, but they tend to say more about the peak than about the period that follows. A record month can coexist with a weakening underlying business if customer reorders, field activity or the normal sales baseline are softening beneath the campaign.
Measuring the half-life does not require sophisticated analytics. It does require a fair comparison: what might the business reasonably have done without the initiative? Once that baseline is agreed, the work is straightforward: define the initiative window; estimate the incremental lift above the baseline; track how much of that lift remains after the initiative ends; and identify when half of it has disappeared. Where the data allow, it is also important to distinguish new customer demand from purchases brought forward or distributor inventory movements.
When leadership reviews several initiatives in this way, three broad profiles tend to emerge. A short half-life — from a few weeks to a quarter — suggests that the lift may have been largely activity-driven: the field responded to the campaign, but customer or partner behaviour did not change enough to sustain it. A longer half-life — two or three quarters, or more — points to a stronger result, with customers reordering, new partners building useful habits or local leaders sustaining activity beyond the event. Growth can then compound because each initiative starts from a better base.
The most troubling profile is negative decay, or a baseline reversal: after the initiative ends, the business falls below where it stood before. This can happen when customers learn to wait for discounts, incentive qualifications pull purchases forward rather than create new demand, or leaders push hard for a short-term target without building an organization able to repeat the result. The weakness may remain hidden until the next campaign is reduced or postponed and sales fall sharply.
The half-life is therefore more than a marketing metric. It helps leaders distinguish between building a business and temporarily renting activity.
Problem two: the promotion ratchet
Promotions and incentives can be valuable, but they can gradually begin to replace the organic growth engine they were intended to support. One campaign lifts the peak; that peak becomes the reference point for the next plan; and soon the next promotion has to be larger simply to show progress.
Three effects often reinforce this pattern. Pull-forward shifts purchases that would have happened later into the campaign period. Promotion conditioning teaches customers and partners to wait for offers, making regular purchasing habits harder to sustain. Expectation inflation turns what once felt like a special reward into something the field considers normal. The result can be a ratchet: the cost of every additional point of growth rises while the underlying baseline remains flat or erodes.
The fix: a four-pillar model for sustainable momentum
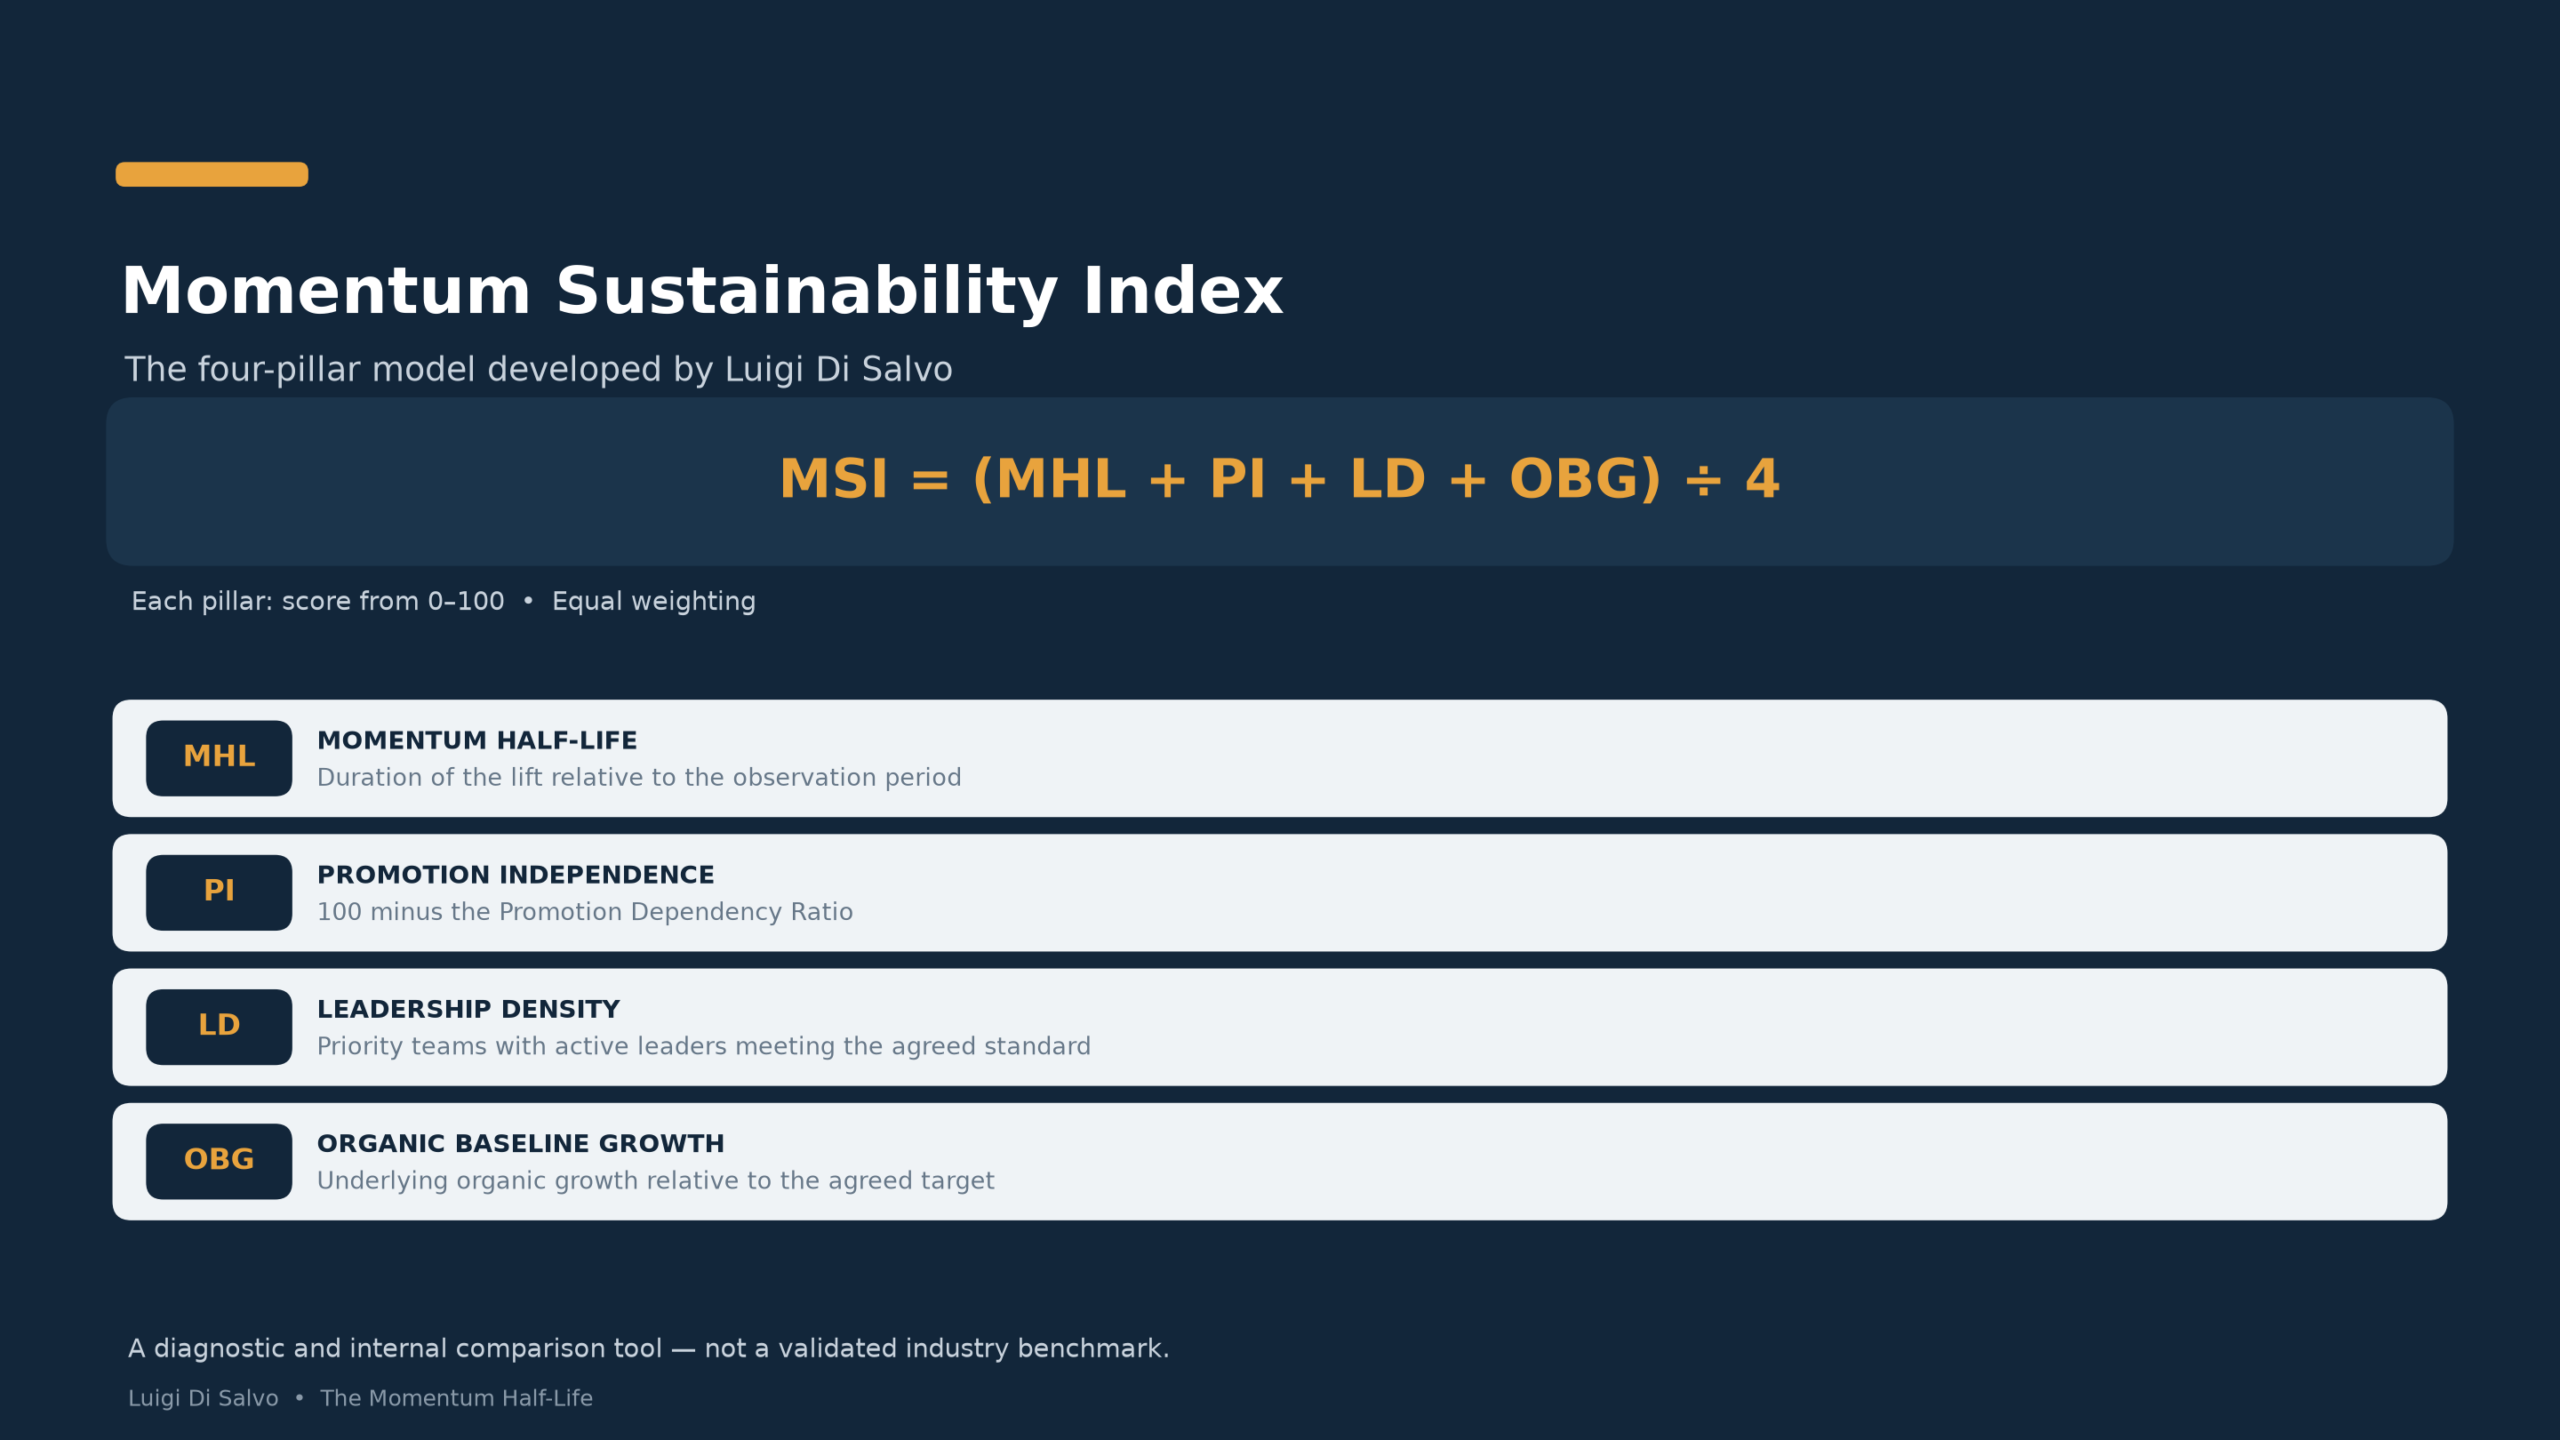
The answer is not to abandon events or promotions, but to manage them as investments and judge them by what they leave behind. Revenue and recruitment show how much activity has occurred; on their own, they do not tell leadership whether the business can sustain it. A more complete review therefore looks at four connected pillars: the duration of the lift, the business’s reliance on promotions, the capacity of local leaders to support growth, and the direction of the underlying business once temporary effects are removed.
- Momentum Half-Life measures how long the incremental effect of an initiative persists after it ends. The starting point is a reasonable baseline: what the business would likely have done without the event, launch or promotion. If an initiative adds 100 units above that baseline and, four months later, only 50 of those units remain, its estimated half-life is four months. A short half-life does not automatically make a campaign unsuccessful — some campaigns are deliberately seasonal — but repeated short-lived lifts suggest that each new promotion may be replacing, rather than building on, the last.
- Promotion Dependency Ratio (PDR) measures how much of annual volume is generated during promotional periods. It is calculated as promotional-period volume divided by total volume over the same twelve-month period. For example, if a business records 35 million units in promotional periods out of 100 million units for the year, its PDR is 35%. That figure is not inherently good or bad: product seasonality, market maturity and the company’s campaign calendar all matter. What deserves attention is a rising PDR, especially when total volume is flat, because it can indicate that a growing share of the business is being concentrated in campaigns rather than supported by regular demand.
- Leadership Density measures whether the organization has enough active, capable local leaders for the size and complexity of its business. Job titles alone do not establish leadership capacity; what matters is whether leaders are available to coach partners, support customers and maintain activity between corporate initiatives. For practical measurement, define a minimum standard in advance — for example, the leadership coverage a priority team needs to serve customers and develop new partners — and calculate the share of priority teams that meet it. If 6 of 10 priority teams meet the standard, Leadership Density is 60%. The appropriate standard will differ by business model, so consistency matters more than adopting someone else’s threshold.
- Organic Baseline Growth (OBG) measures the underlying growth trend after promotional spikes, seasonality and identifiable pull-forward have been taken into account. It answers a basic question: is the business growing between campaigns, or are the headline results being carried by a few promotional months? If the agreed organic-growth target is 8% and the adjusted baseline is growing at 5%, the business has achieved 62.5% of that target. This is a more useful signal than comparing campaign peaks alone, provided the baseline and target are set consistently.
A practical scorecard: the Momentum Sustainability Index
To bring the four pillars into one executive conversation, I developed the Momentum Sustainability Index (MSI). It converts each pillar into a score from 0 to 100 and takes a simple average, so the result is easy to read while the individual scores retain the detail leaders need to act.
- Momentum Half-Life score: (estimated half-life ÷ agreed observation period) × 100, capped at 100. For a six-month review window and a four-month half-life, the score is 66.7.
- Promotion Dependency Ratio (PDR): (volume recorded during promotional periods ÷ total volume over the same rolling 12 months) × 100. The score used in the MSI is Promotion Independence = 100 − PDR; a PDR of 35% therefore gives a score of 65.
- Leadership Density score: (priority teams meeting the agreed active-leadership standard ÷ all priority teams) × 100. If 6 of 10 teams meet it, the score is 60.
- Organic Baseline Growth score: (adjusted organic growth ÷ the company’s positive, pre-agreed growth target) × 100, capped between 0 and 100. If actual adjusted growth is 5% against an 8% target, the score is 62.5.
MSI = (Momentum Half-Life score + Promotion Independence score + Leadership Density score + Organic Baseline Growth score) ÷ 4
Consider a business reviewing its performance over six months. An initiative’s lift falls from 100 incremental units to 50 after four months, so its half-life is four months and its score is 67 (4 ÷ 6 × 100). Promotional periods account for 35% of annual volume, giving a Promotion Independence score of 65 (100 − 35). Six of the ten priority teams meet the agreed leadership standard, so Leadership Density is 60. Finally, adjusted Organic Baseline Growth is 5% against an 8% target, producing a score of approximately 63 (5 ÷ 8 × 100). The MSI is therefore:
MSI = (66.7 + 65 + 60 + 62.5) ÷ 4 = 63.55, or approximately 64
How to read the score
For an initial management discussion, the following traffic-light bands can help: 70–100 is green, indicating a relatively strong overall balance across the four pillars; 40–69 is amber, indicating a mixed picture that merits attention; and 0–39 is red, indicating that one or more structural weaknesses may be putting growth at risk. These are proposed operating references, not scientific cut-offs or direct-selling industry norms. A company should test them against its own history, market maturity and business model, then adjust them if its evidence points to more meaningful thresholds. Because an average can conceal an individual weakness, any pillar below 40 should also be flagged for attention, even when the overall MSI falls in the green band.
In the example above, an MSI of 64 sits in the amber range. That does not mean the business is failing: it means the evidence is not yet strong enough to call the growth durable. The separate pillar scores make the diagnosis clearer. The half-life score of 66.7 is close to green, while the PDR of 35% leaves the business meaningfully exposed to promotional periods; leadership coverage at 60% and organic growth at 5% against an 8% goal point to the more immediate opportunities. A sensible response would be to strengthen leadership in uncovered teams and improve the ordinary, non-promotional growth base, rather than simply adding a larger campaign.
The combined index should never replace the component scores. Two markets can post the same MSI and require very different decisions. Suppose Market A scores 80 on Momentum Half-Life, 50 on Promotion Independence, 80 on Leadership Density and 60 on Organic Baseline Growth. Its MSI is 67.5, or about 68. Market B scores 55, 75, 55 and 85 respectively; its MSI is also 67.5. Market A retains its lift and has stronger leadership, but half of its annual volume comes from promotional periods and its organic growth is modest. Market B is less promotion-dependent and has stronger underlying growth, but its lift fades sooner and its leadership coverage is thinner. The same total therefore points to different priorities: Market A should reduce campaign reliance and improve baseline growth; Market B should build local leadership and improve the persistence of its initiatives.
Comparisons are most useful when the observation period, promotion definitions, target-setting method and leadership standard are the same. Compare markets at similar stages of maturity, or compare the same market over successive periods using the same method. A six-month post-launch score should not be set directly against a twelve-month score, and a business should not interpret a change in MSI as improvement if it has also changed the definitions behind the pillars.
The MSI is a practical framework I created to make a broad management discussion more concrete, not a claim that four numbers can capture every feature of a market. Its value lies in combining an overall signal with a clear explanation of what is driving it; the proposed score bands should be refined as the company builds a history of comparable results.
- Set baseline targets, not just peak targets. Review a promotion after it has ended, not only during the week when activity is highest. The useful question is what part of the lift remains two quarters later. If the initiative has no clear reason for customers to stay or for new partners to build lasting habits, it may be buying short-term volume rather than creating durable growth.
- Build leadership capacity alongside volume. Local leaders help customers, coach new partners and keep activity moving between corporate campaigns. A market can absorb a sudden increase in sales faster than it can develop the leadership needed to maintain it, so expansion is strongest when local capability keeps pace with volume.
- Make the post-campaign review part of the initiative. Before an event or promotion begins, agree how success will be assessed after it ends and who will review the result. That discipline helps the organization learn which initiatives build repeat behaviour, which merely shift activity, and what to change next time.
What lasts
There is a version of direct selling that runs from one surge to the next, with ever-larger events and incentives asked to replace growth the previous campaign could not hold. There is another in which each initiative leaves something useful behind: customers with reasons to return, partners with stronger capabilities and local leaders able to support the next stage.
The companies that last are not necessarily those with the biggest spikes. They are the ones that retain more of the progress those spikes create.
Momentum is not an event. It is an asset — and assets deserve to be measured.
About the author
Luigi Di Salvo is Vice President EU, CIS & MENA at JIFU Global. Considered as one of the maximum experts in strategies for sustainable growth in the industry. He has more than 25 years of experience in direct selling and network marketing, with strategic leadership responsibility across Europe, CIS and MENA and business development spanning more than 50 markets. His work has focused on multi-country sustainable growth, market entry, sales & leadership development, incentive architecture and operational execution.
Systemen sowie der operativen Umsetzung.
Foto: Copyright marketer zeta Jifu